


It wasn’t a merry advent period, indeed it was the worst December for markets in three decades. Bah humbug.
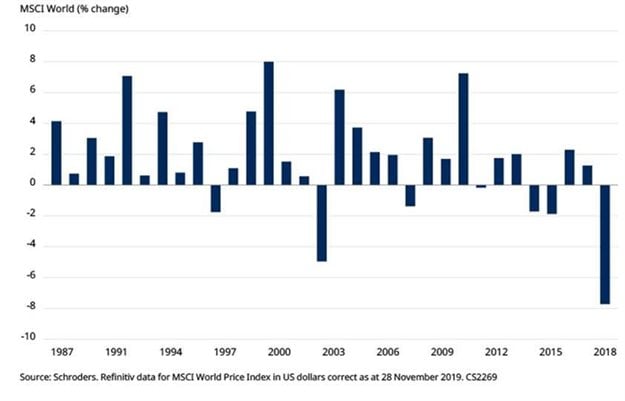
The global index fell 7.7%, crushing any hope of a “Santa Rally” for only the seventh time in the last 32 years. But although 2018 was miserable, December remains one of the most prosperous months for stocks.
The “Santa Rally” is a supposed effect of the Christmas feel-good factor, helping stock markets rise at the end of the year, although many seasoned investors remain unconvinced.
It’s unwise to draw firm conclusions from stock market history but in the spirit of festive fun, Schroders analyses the data each year. The data shows that global stocks have in fact risen in 78.1% of Decembers since 1987, with stock prices up on average 1.7%, perhaps adding some substance to the “Santa Rally” myth.
While December has been a consistent month for stocks rising, April is the most prolific. It matches December for consistency but the average April rise for stocks (2.1%) has been higher over the last three decades.
The next best months were July and November. Stocks have risen 65.6% of the time in both those months, but July boasts a better average rise in stock prices, 1.4% versus 0.7% for November.
June was the worst month for markets, with stocks gaining just 34.4% of time. August was the worst month for stock market performance, when stocks fell an average of -1.1%.

Investors should note the data for the month of October. It seems to underline the unpredictability of markets. October has the third highest frequency of gains and the joint third highest average rise. But historically it is also the month that has included some of the biggest stock market falls.
On 19 October 1987 global stock markets crashed amid worries about a slowing global economy and high stock valuations. The concerns were compounded by a computer glitch. Global stocks fell on average by 23% in October that year.
The Asian financial crisis began in the summer of 1997. A sequence of currency devaluations in Asia rocked global confidence. Global stocks fell by 6.6% in October that year.
The seeds of the global financial crisis were sown when the US housing market began to collapse in 2007. The full extent wasn’t realised until Lehman Brothers investment bank collapsed in September 2008. The global financial system seized up and a month later global stocks had fallen by more than 15%.
Investors fretted about issues such as US-China trade tensions, European political uncertainty and the withdrawal of quantitative easing stimulus programmes. Global stocks fell 7.4% that October. It was the worst monthly performance for stocks globally in six years and it was the tenth worst in the last decade.
There is much speculation as to the reasons for the “December effect”. One theory is based around investor psychology. There is, perhaps, more goodwill cheer in the markets due to the holiday season putting investors in a positive mood, which drives more buying than selling.
Another view is that fund managers, which account for a substantial part of share ownership, are re-balancing portfolios ahead of the year-end. By selling some better performing stocks managers can afford to buy more of the underperforming ones, pushing up prices.
The dramatic stock market fall in December last year proves two things: past performance cannot be relied upon and stock market superstitions are only true until they fail to be.
Stock market history can be fascinating, but it can often lead to assumptions – that Octobers are bad or that you should sell in June because summer months are poor performers.
In fact, trying to time markets at all is a questionable strategy as it is impossible to predict short-term movements in the market.
Separately, Schroders’ calculations also showed if in March 2003 you had invested $1,000 in the MSCI World and left the investment alone for the next 15 years it would have been worth $4,211. Figures have not been adjusted for inflation or fees.
However, if you had tried to time your entry in and out of the market during that period and missed out on the index’s 30 best days the same investment would now be worth $1,268, or $2,943 less.
Investors’ best bet is to be patient and give their investment time to grow. The general rule is five years to allow for stock markets to go through their natural cycles.
As with all investing, the value of investments and the income from them may go down as well as up and investors may not get back the amounts originally invested.