Understand what the data is really saying
As the campaigns are running you notice that they are indeed delivering on the goals, but did it ever cross your mind that maybe it is just a little bit too good to be true? That maybe you need to investigate a bit more and try to understand the Display & Video 360 Platform (DV360, part of the Google Marketing Platform) where all your clicks, viewability and conversions are coming from?
Previously the reporting UI was very intimidating for clients and auditing the accounts proved a confusing and laborious task, selecting and deselecting boxes and reports split on creative as well as just regular data levels.
In recent months Google has given clients a less intimidating UI and new way to make sure their agencies are working correctly, as well as spending budgets correctly. This is great news for clients as it gives them more control with better and easier access to information that will ultimately hold agencies more accountable for what happens in the campaigns.
Push your agency to action with data nuggets
It’s as easy as pressing one little button (like the one below). It's called "Segment By" and can be located in your Insertion Orders or Line Items.
Once clicked a drop-down will appear which looks like this:
As you can see this is already looking super friendly and intuitive, but let's take a look at what data you can gather from the UI and then how you can push your agency into action.
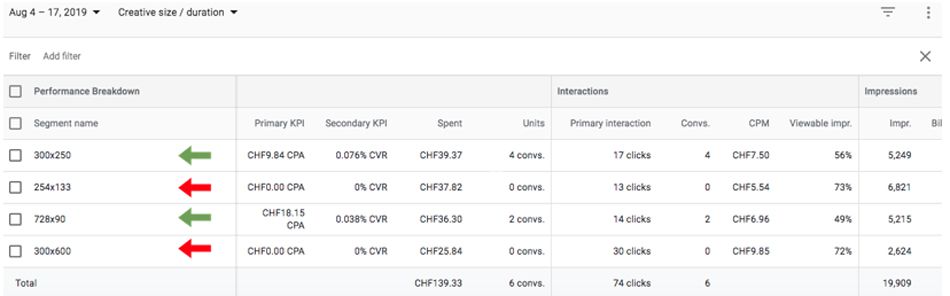
The graph below features the creative sizes currently in use with the campaign.
We can see that only two creatives are converting whereas the other two are essentially wasting budget, and this immediately poses the question to the agency as to why these creatives are still running. This insight also arms the clients with the knowledge that they should only focus on the positive sizes with regard to future creative production, and this will also ultimately save money in the long term too.
Let's look at another aspect, and this report covers environment:
Here we can see money being spent on environments which are neither converting, nor providing any real clicks to help aid any remarketing in terms of filling the remarketing funnel, assuming that strategy had been implemented. So again client now has the right information to ask agency just what is happening here.
It doesn't stop there.
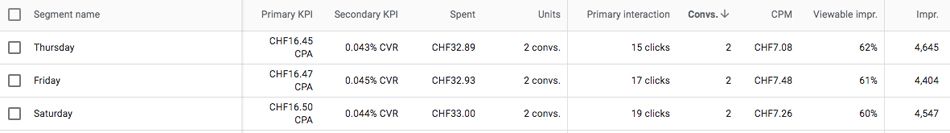
The DV360 Reporting feature can help clients be on top of their budgets and on top of performance, monitoring all aspects of the campaign, including for example, which regions are performing better or what sites exactly your conversions are coming from, to monitoring the best performing days of the week:
Own your data, become more granular, and hold agencies accountable.
If you have any questions or if you need any advice contact us here or call us on 021 446 2300.