“Lightstone’s analysis provides a snapshot of SA’s property market which highlights widely different ratios of formal to informal housing from one province to another, where age and wealth bands live, and the volume and value of properties transacted,” says Hayley Ivins-Downes, head of digital at Lightstone Property.
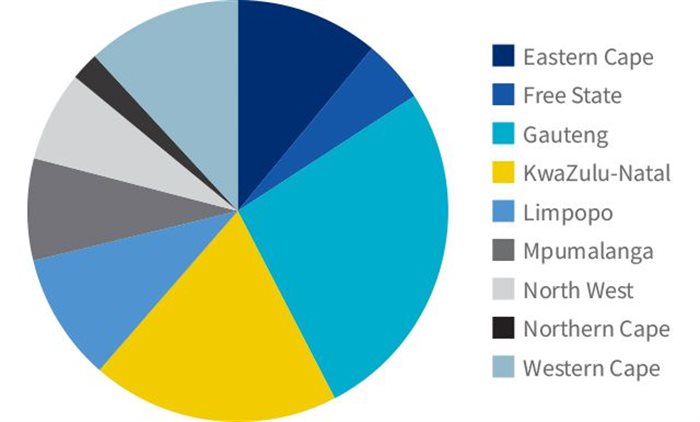
Just more than 16 million (27%) of South Africa’s 60.5 million people live in its engine room, Gauteng, while 11.5 million (19%) live in KZN and 7.2 million people (12%) live in the Western Cape.
Northern Cape is least populated with 1.3 million (2%) people, followed by Free State at 2.9 million (5%) and North West with 4.1 million (7%), Mpumalanga with 4.7 million (8%), Limpopo with 5.9 million (10%) and Eastern Cape with 6.6 million (11%).
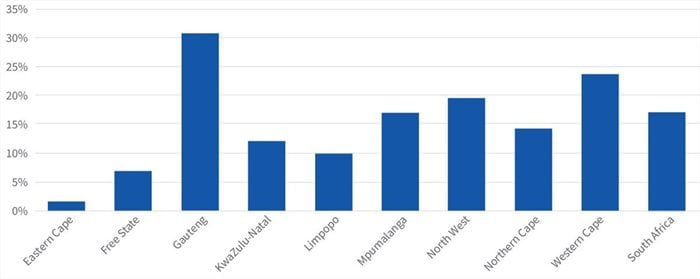
Three provinces have recorded population increases in the years 2011-2022 above the national average of 17%, while one province – Mpumalanga – was in step with the national average.
Gauteng (31%), Western Cape (24%) and North West (20%) have grown above 17%, suggesting inward movement of people from other provinces for a variety of reasons – in some cases, lifestyle changes as people search for greater safety and security or better service delivery, but in most cases the imbalance suggests people moving to provinces where there is a greater perceived prospect of work.
“The movement of job seekers to Gauteng and Western Cape is well documented – Gauteng is the country’s economic and political hub while Western Cape has a growing reputation as the country’s best-run province and is increasingly attractive to semigrants and those who can work remotely,” continues Ivins-Downes.
The Eastern Cape (2%) has shown the least population growth, followed by Free State (7%), Limpopo (10%), KZN (12%) and Northern Cape (14%). Poor economic prospects have affected these provinces, and the steady flow of people to Gauteng, the Western Cape and North West is evidence of this.
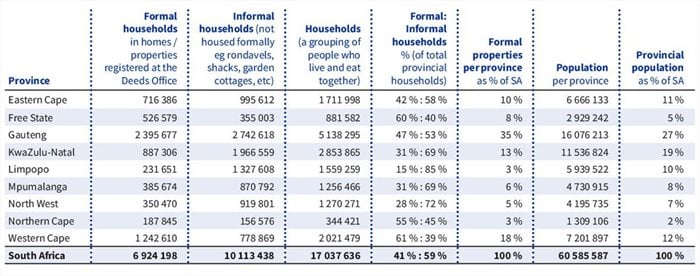
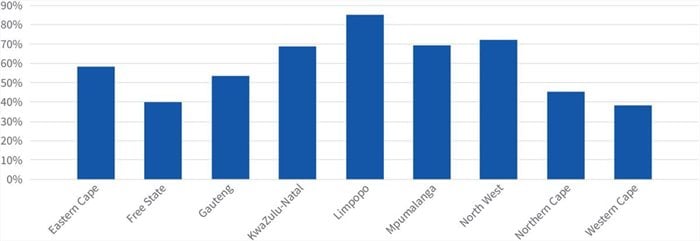
The data (see table below) assessed by Lightstone highlights vast differences between provinces when it comes to formal and informal households.
Of South Africa’s just more than 17 million households, almost 7 million (41%) reside in properties registered at the Deeds Office while the remaining 10 million (59%) live either with other families or in informal properties (not registered at Deeds Office).
The Western Cape has the highest percentage of households (61%) living in formally registered properties and, in terms of numbers, the third-least number of households in informal properties.
On the other hand, Limpopo has by far the lowest percentage (15%) of households living in formally registered properties, which means a staggering 85% of households (the third-largest provincial number at 1.3 million) live in informal accommodation. Its population is growing at only 3%, likely due to significant migration of those seeking work opportunities elsewhere.
North West (28%) and Mpumalanga (31%) are next lowest in terms of formal households, while Free State (60%) is just behind the Western Cape, and ahead of Northern Cape at 55%.
Young people (under 18 years of age) are the largest age band in all provinces, followed by those 18 to 30 – except in Gauteng, where the 30 to 40 age group are second. In fact, young people make up just 28% in Gauteng, the province whose population is growing most strongly in percentage terms ahead of the national average. The young, plus under 30 age band (20%) in Gauteng account for 48%, while the over 60s for only 7.5% - which means the most economically productive 30-60 age group accounts for 44.5% of people in the province.
This is significantly different in Limpopo, where young people account for 39% of the population, and this rises to 61% if under 30s are added. Over 60s make up around 8.5%, which leaves just more than 30% in the most economically productive 30-60 age group – nearly 15% less than in Gauteng.
According to Ivins-Downes, using Gauteng and Limpopo as proxies for the nine provinces, it suggests the economically stronger provinces have greater numbers in the middle ages, while the economically weaker provinces have proportionately more younger and older people – and less of those in the most productive economic years.

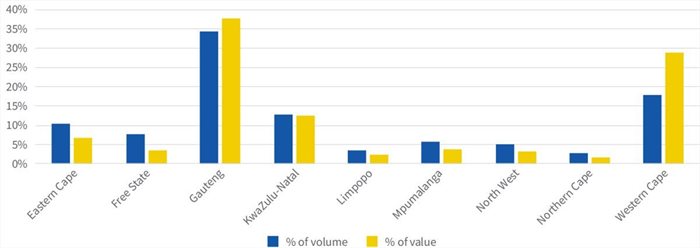
Gauteng and the Western Cape, the country’s economic powerhouses, dominate volumes and value in the property market, with 65% of the property stock, and 79% of the stock value (as opposed to 58% of the population).
The Western Cape accounts for 18% of the volume but 29% of the value, a significantly higher differential than Gauteng, the only other province where value exceeds volume (38% value, 35% volume). KwaZulu-Natal follows with 13% in both volume and value. At the low end, the Northern Cape accounts for 3% of volumes, and just 1% of value – but it is SA’s least populated province with 1.3 million people, yet fared only marginally behind Limpopo, which has 5.9 million people.
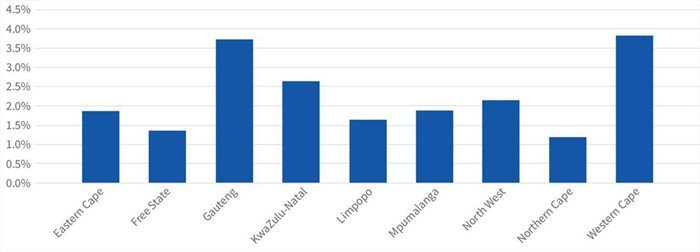
Gauteng and the Western Cape led the way in terms of churn (graph below) with Western Cape leading on 3.9% and Gauteng marginally behind on 3.7%, while the Northern Cape (1.2%) and Free State (1.4%) were the least active.
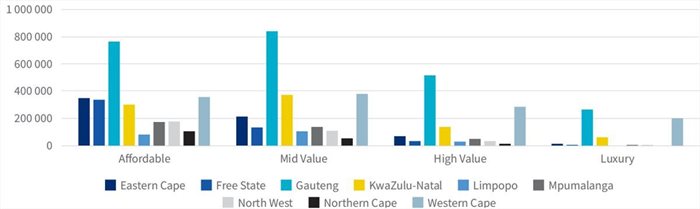
Luxury properties account for 16.5% (203,824) of the Western Cape’s stock, slightly ahead of Gauteng’s 11.3% (269 453). Luxury properties account for just 0.5% of the total in Northern Cape and 0.9% in Limpopo.
In terms of affordable housing, Eastern Cape has 54% of its housing stock in this category. The percentages for the other provinces are Free State 65%, Gauteng 32%, KwaZulu-Natal 34%, Limpopo 38%, Mpumalanga 46%, North West 53%, Northern Cape 59% and Western Cape 27%.